Data visualizations
Charts and analysis from the open settlement dataset. Each one is a finding, written up like a story lead.
Data as of October 21, 2026 · 259 open settlements · $5.83B in funds. The charts below were built from the October 18, 2026 snapshot (241 settlements) and are re-baked on the chart cycle. The “Half of all open settlement money sits in 8 cases” and “Only 21% of open settlement money is easy to claim” charts were refreshed October 22, 2026 from the live dataset (289 open settlements, $6.32B in published funds).
Republish freely with attribution Embed or republish any chart with attribution to Class Action Hero and a link to the dataset: https://classactionhero.app/api/
The easiest money is real: $752M needs zero proof to claim
October 18, 2026
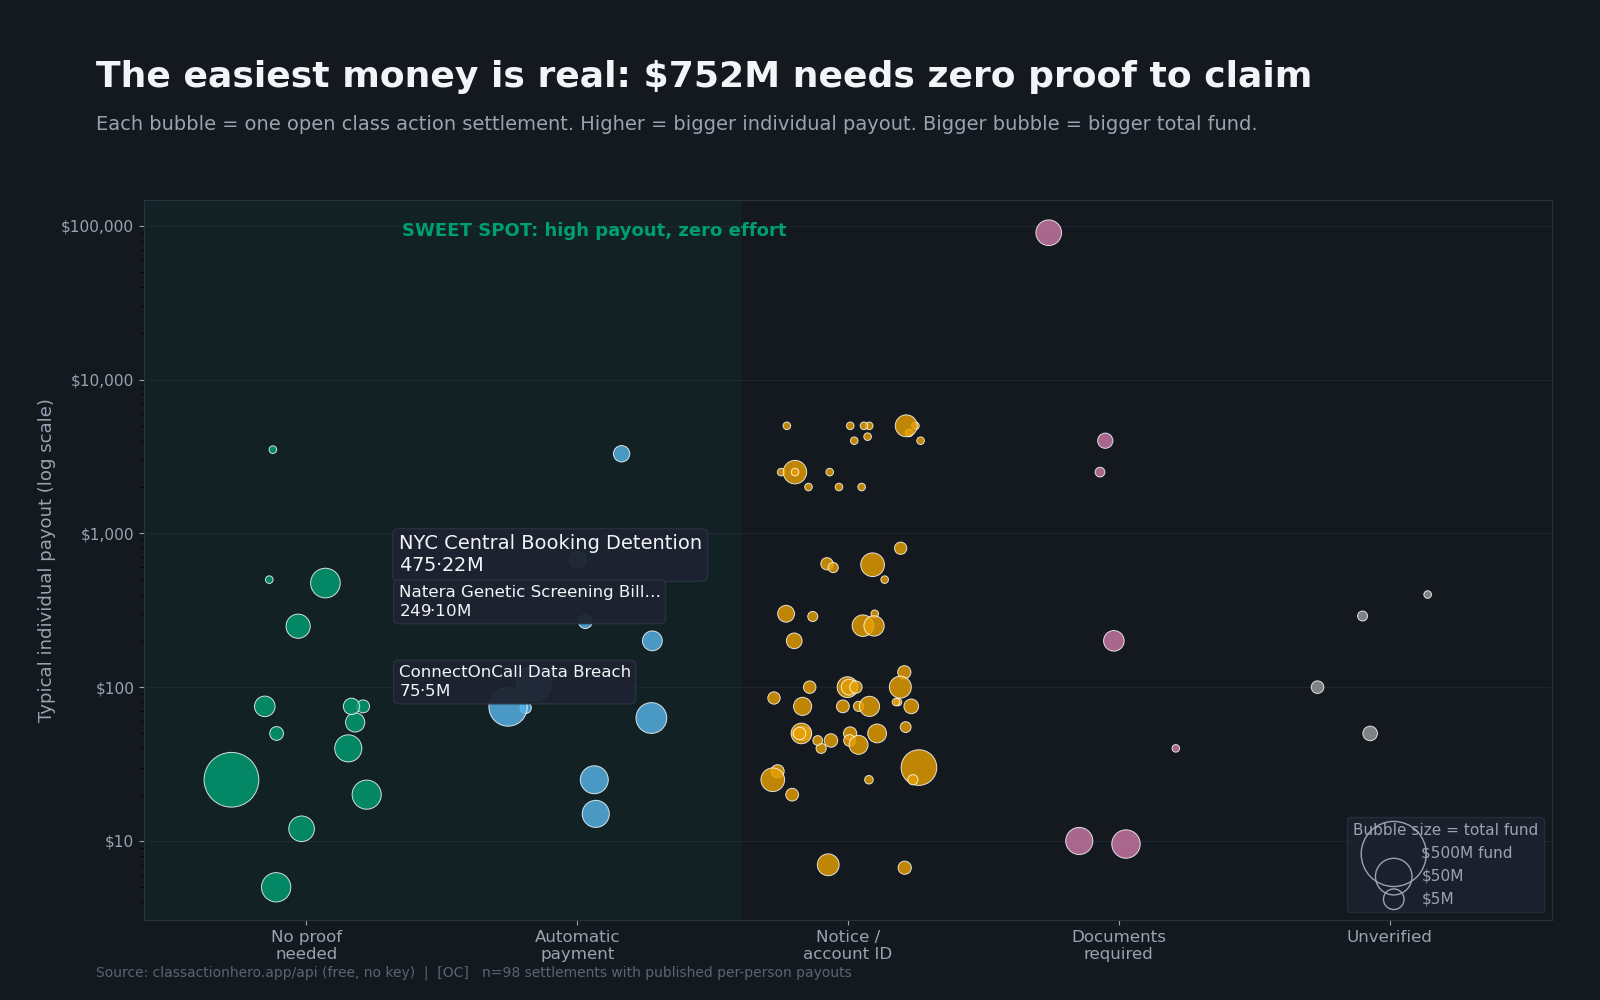
Finding: $752M across 28 open settlements requires zero proof to claim — no receipts, no documentation, just a sworn statement.
The chart maps 98 settlements with published per-person payouts by what it takes to file. The leftmost column — no proof needed — holds some of the highest individual payouts in the dataset, including $475 per detention (NYC Central Booking) and $249 (Natera). The barrier isn't the money; it's knowing the settlement exists.
Method: 98 of 241 settlements publish per-person payout figures; the rest report fund totals only. Proof categories as categorized from official settlement sites. Bubble size = total fund (log scale on y-axis).
Only 21% of open settlement money is easy to claim
October 22, 2026
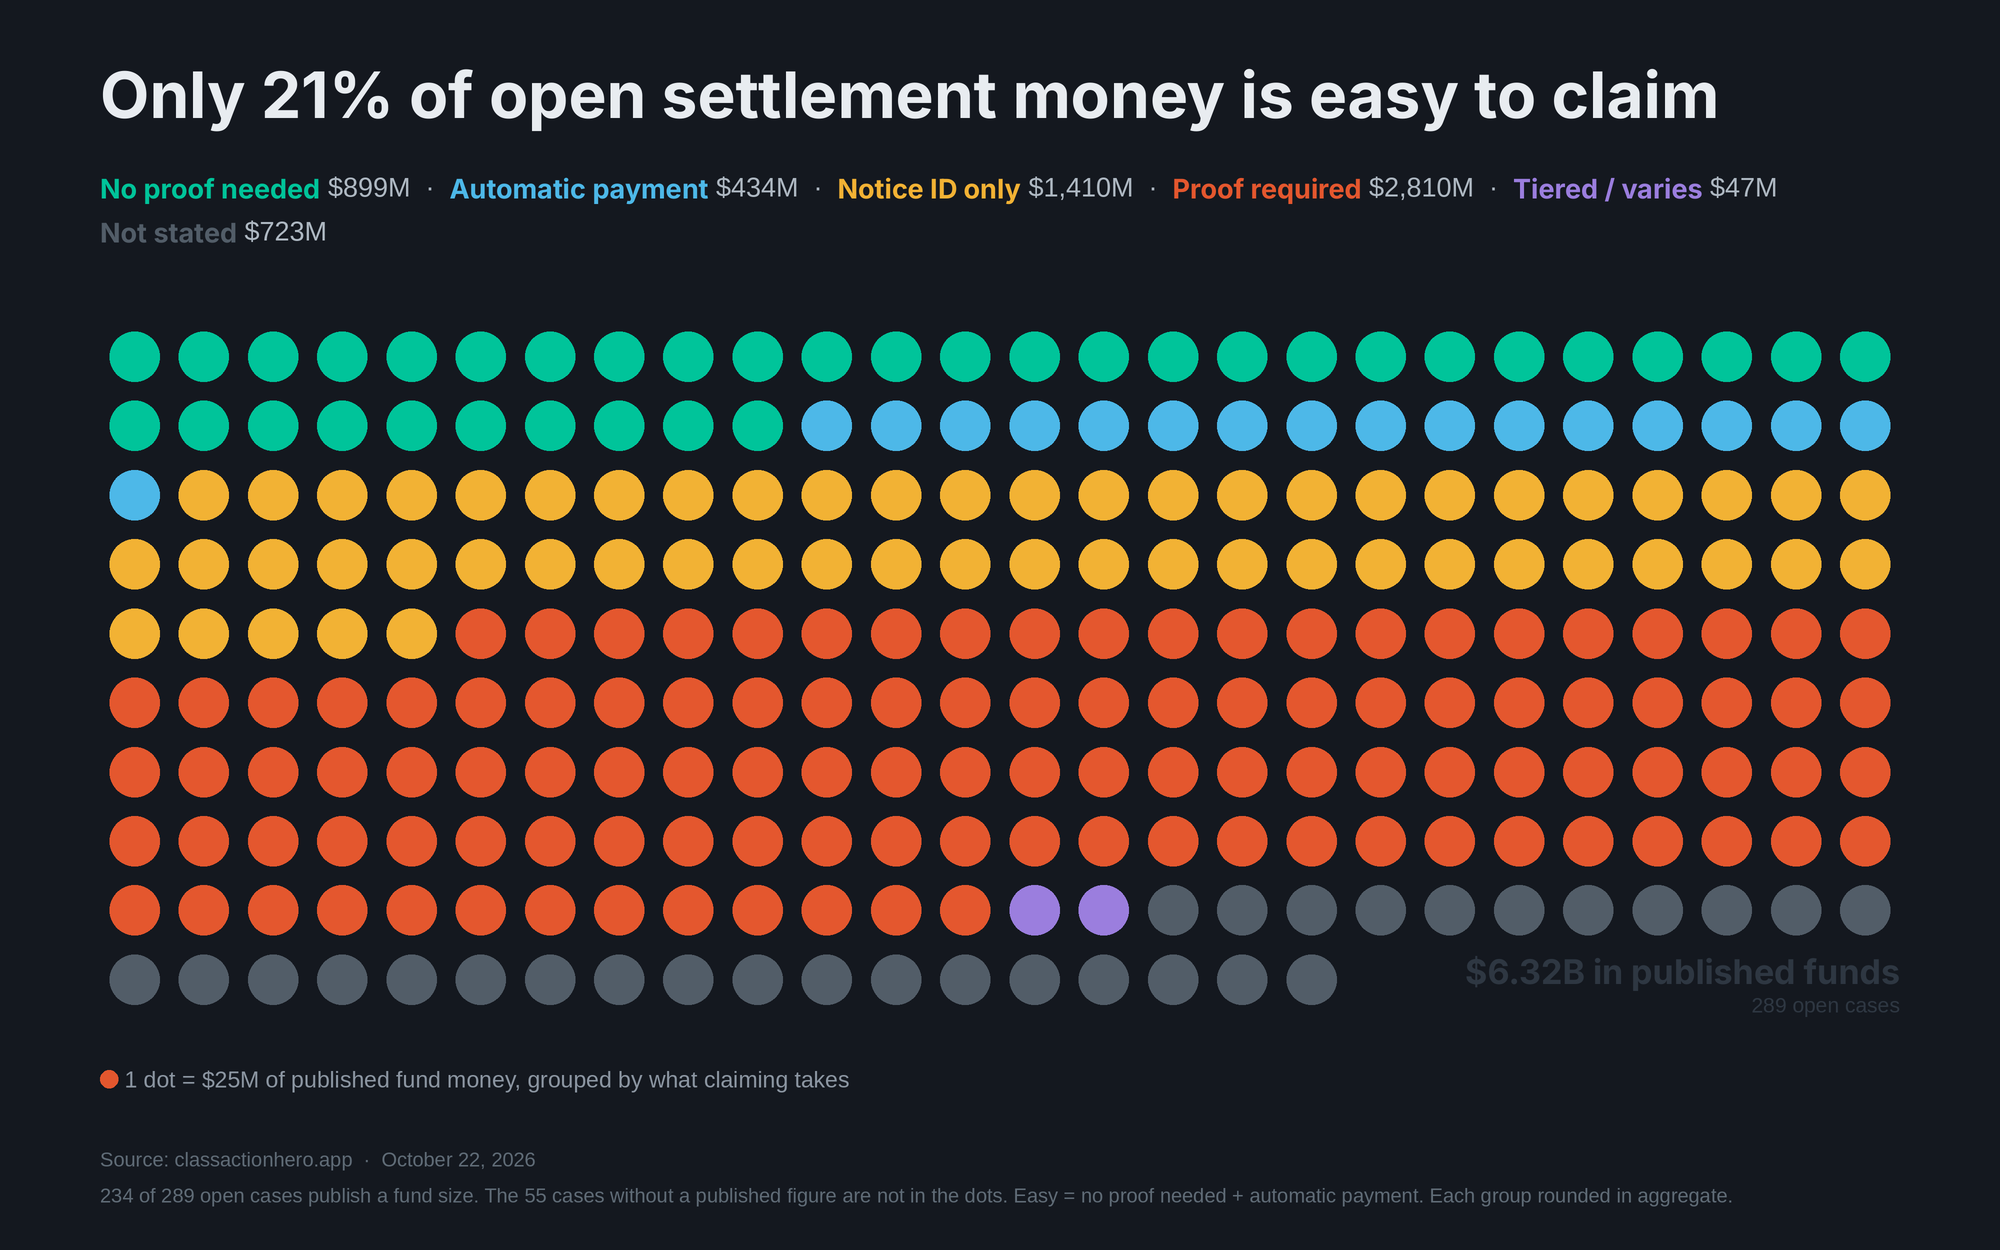
Finding: $1.33B — 21% of published open settlement funds — can be claimed with no proof or automatically. Nearly half ($2.81B) requires gathering documents.
The chart breaks the $6.32B by what claimants must provide. The document burden is the single biggest filter between advertised funds and money people actually receive — and it's invisible in most settlement coverage, which reports the headline fund size.
Method: proof categories from official settlement sites; fund totals from published settlement amounts. "Easy to claim" = no proof needed ($899M) + automatic payment ($434M). 234 of 289 open cases publish a fund size; the 55 cases without a published figure are not in the dots. Each dot = $25M; groups rounded in aggregate (dots imply $6.30B vs $6.32B published, −0.4%). This chart replaces the October 18 claim-funnel version, which was built from that day's snapshot ($4.91B).
$575M expires the week of November 9
October 18, 2026
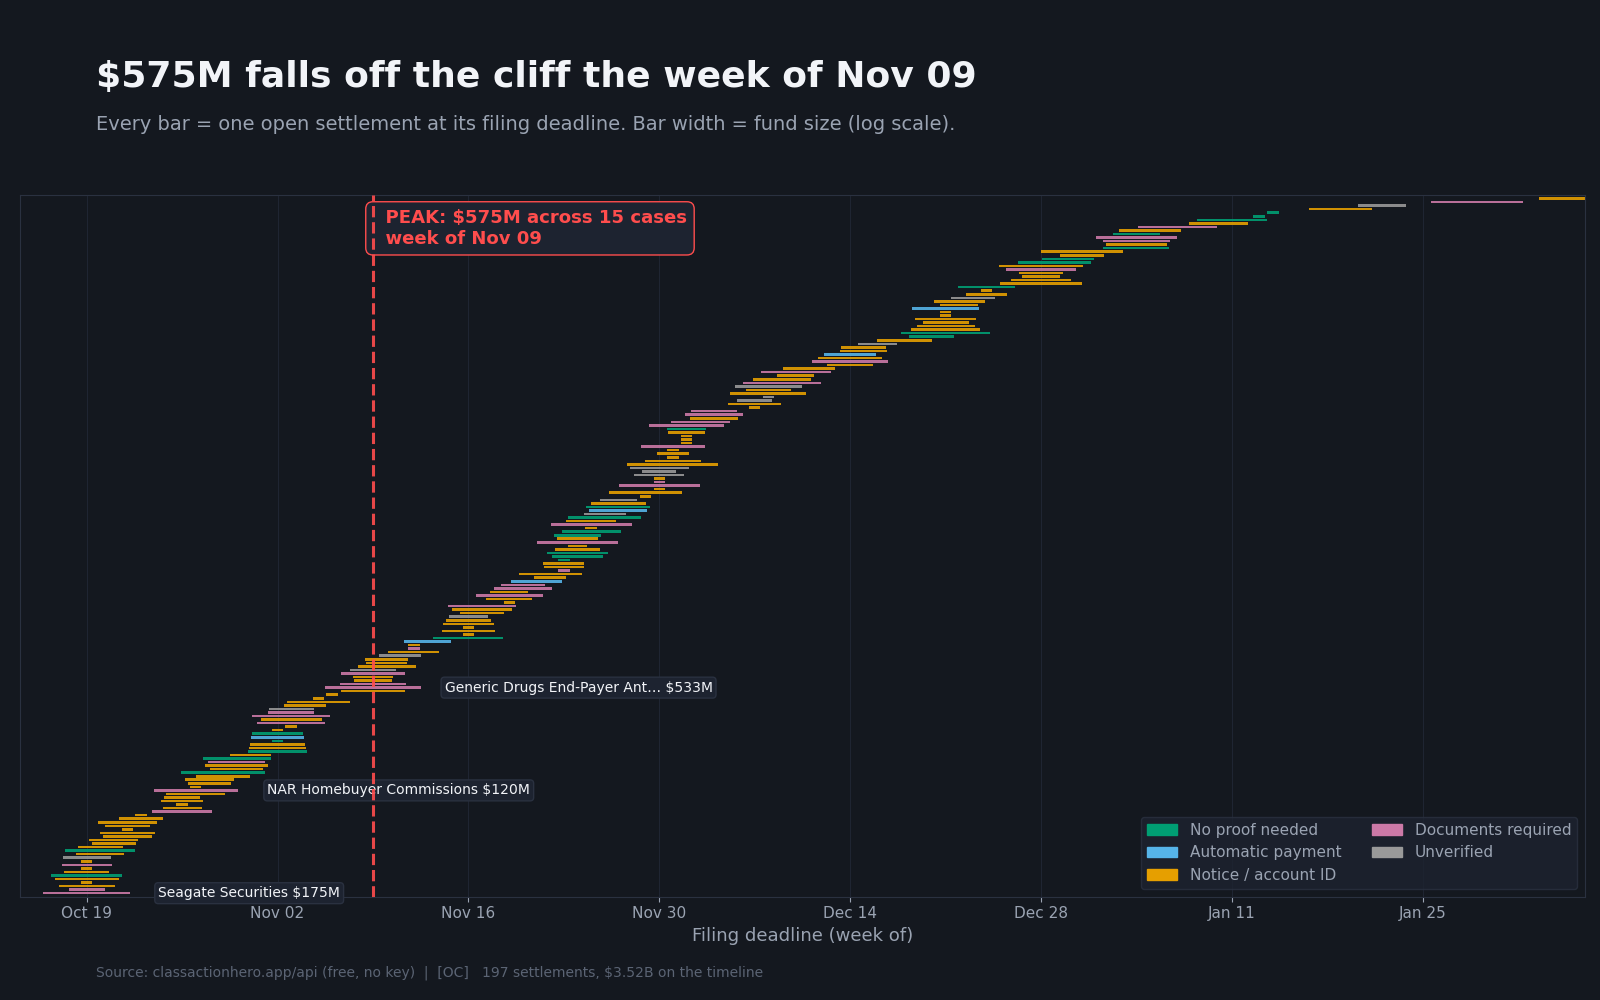
Finding: the week of November 9, 2026 is the largest single-week expiry in the dataset — $575M across 15 settlements, led by the $533M Generic Drugs End-Payer antitrust case.
Settlement deadlines cluster. When a big week passes, hundreds of millions in claim windows close at once — and unlike a news cycle, expired windows don't come back. The chart makes the clustering visible.
Method: 197 of 241 settlements have firm deadlines; the rest are TBD. Bar width = published fund size (log scale). Sorted by deadline.
Half of all open settlement money sits in 8 cases
October 22, 2026
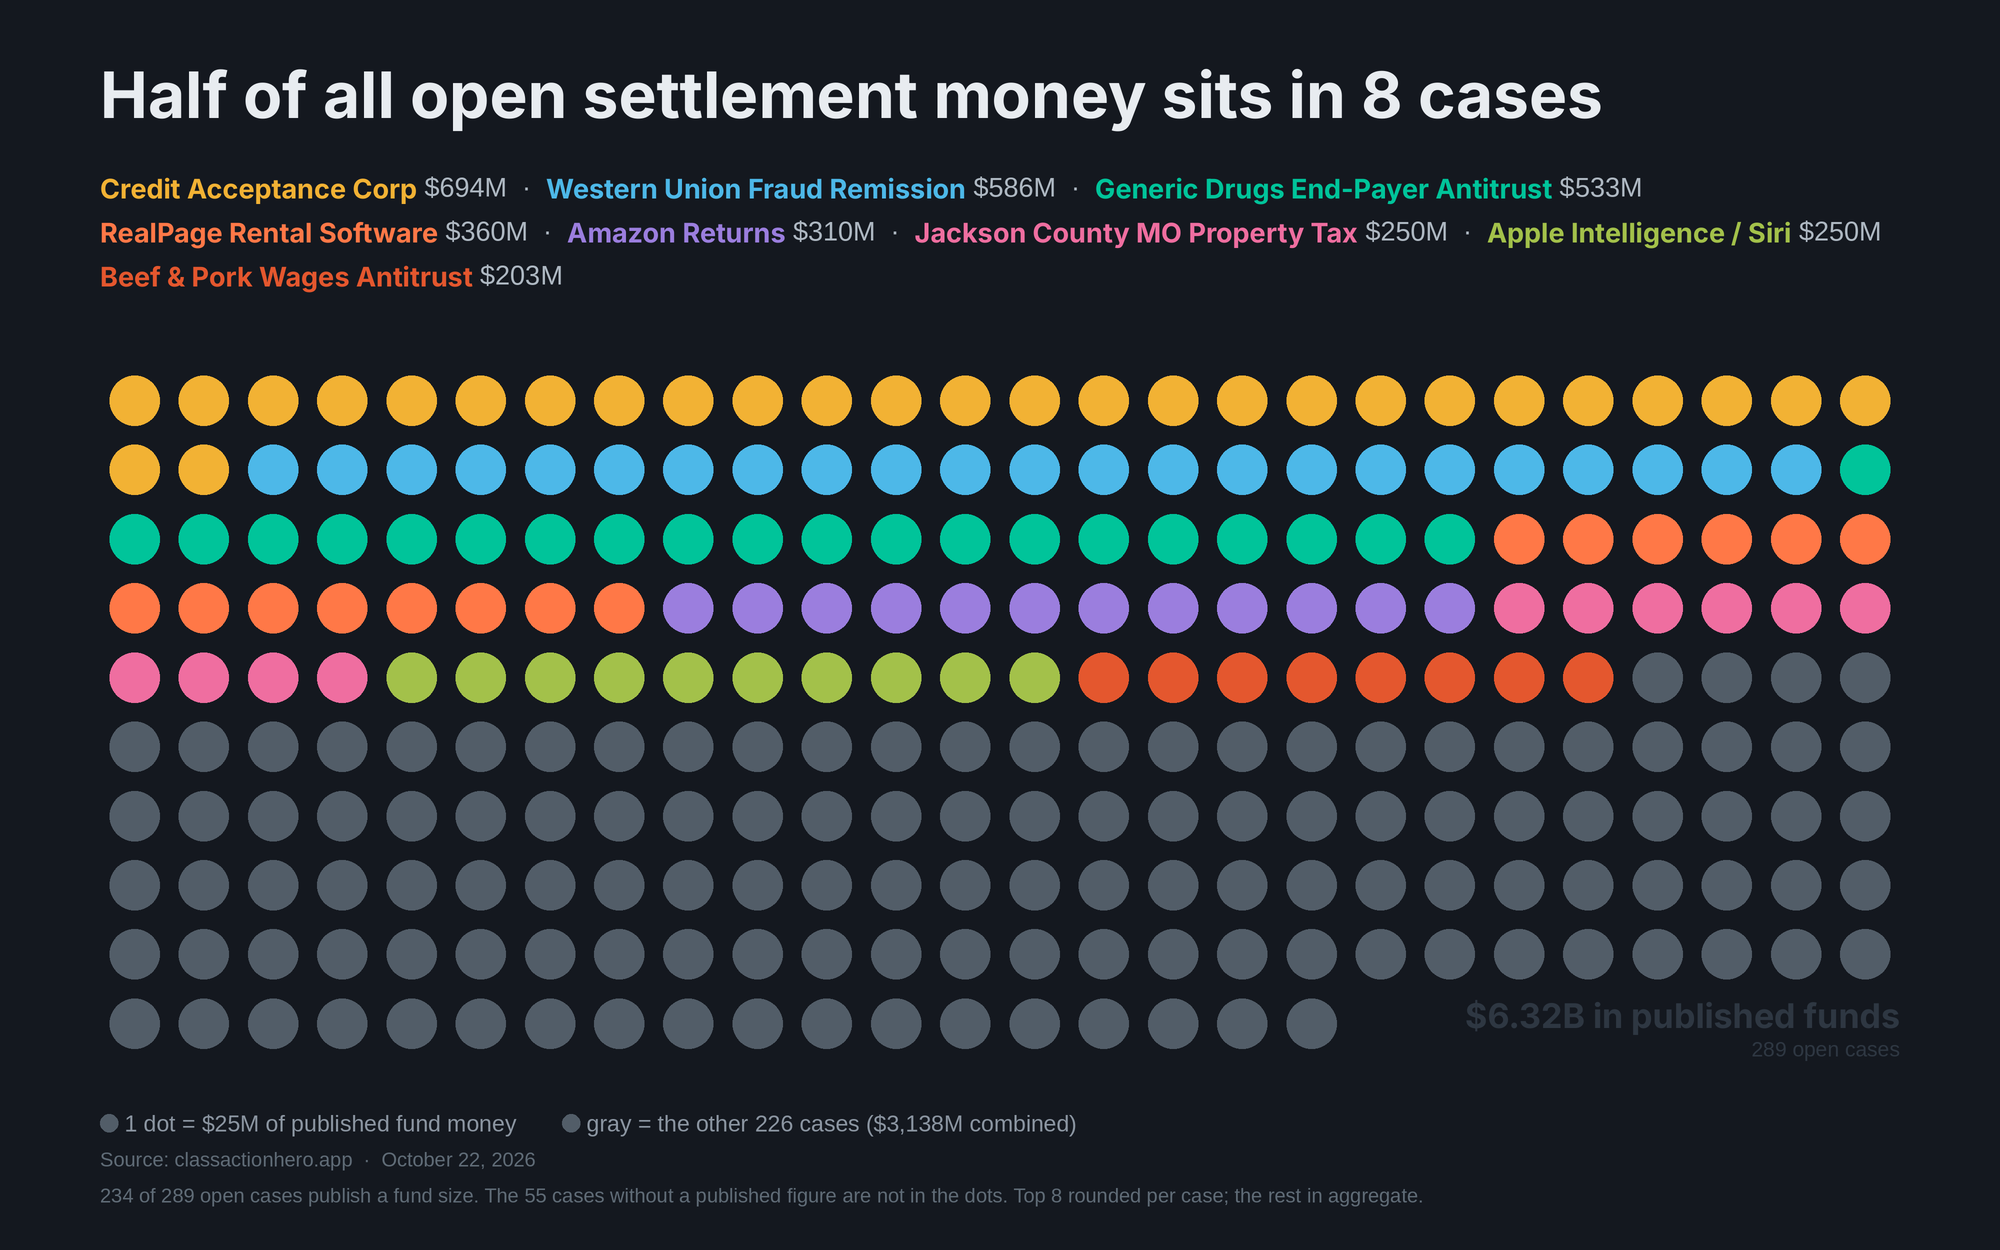
Finding: the top 8 settlements hold $3.19B of the $6.32B in published open funds — 50.4%. The other 226 cases with published sizes split $3.14B.
Each dot is $25M of published fund money. The largest blocks are Credit Acceptance Corp ($694M), Western Union Fraud Remission ($586M), and Generic Drugs End-Payer Antitrust ($533M). The gray field is every remaining case combined — the money in this dataset is concentrated at the top.
Method: 234 of 289 open cases publish a fund size; the 55 cases without a published figure are not in the dots. Top 8 rounded per case to the nearest $25M dot; the remaining cases calibrated in aggregate. Dots × unit = $6.30B vs $6.32B published (−0.4%, rounding).
State-exclusive settlement funds
October 18, 2026
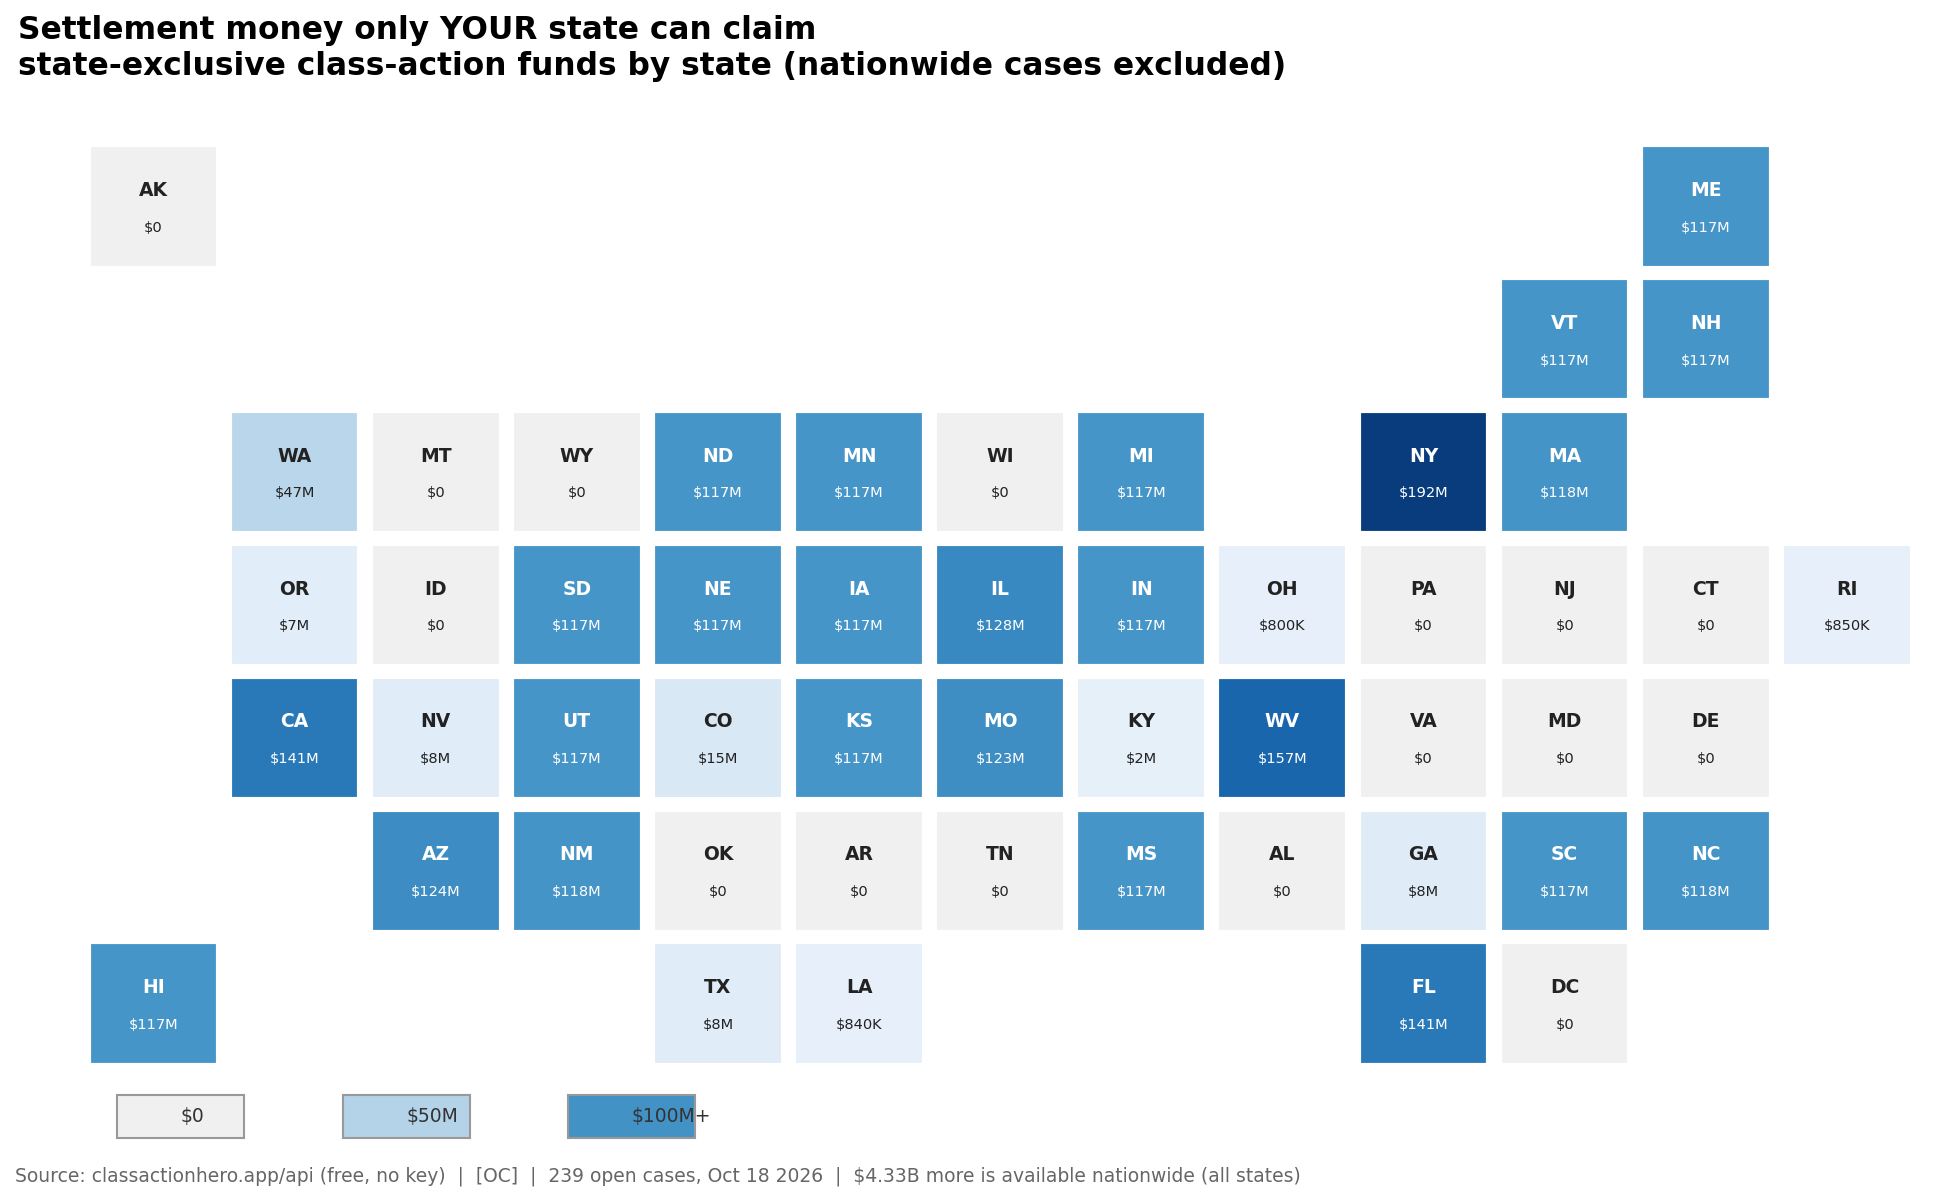
Finding: New York leads state-exclusive funds at $192M (6 cases), followed by West Virginia at $157M (2 cases). 38 states have exclusive funds totaling $3.21B.
State-exclusive settlements are the most overlooked category — they don't show up in national roundups, and eligibility is narrow enough that awareness is the main barrier. The $117M pork price-fixing settlement spans ~16 states.
Method: state-exclusive settlements only; nationwide cases ($4.33B) excluded and noted.
The median class action payout is $72
October 18, 2026
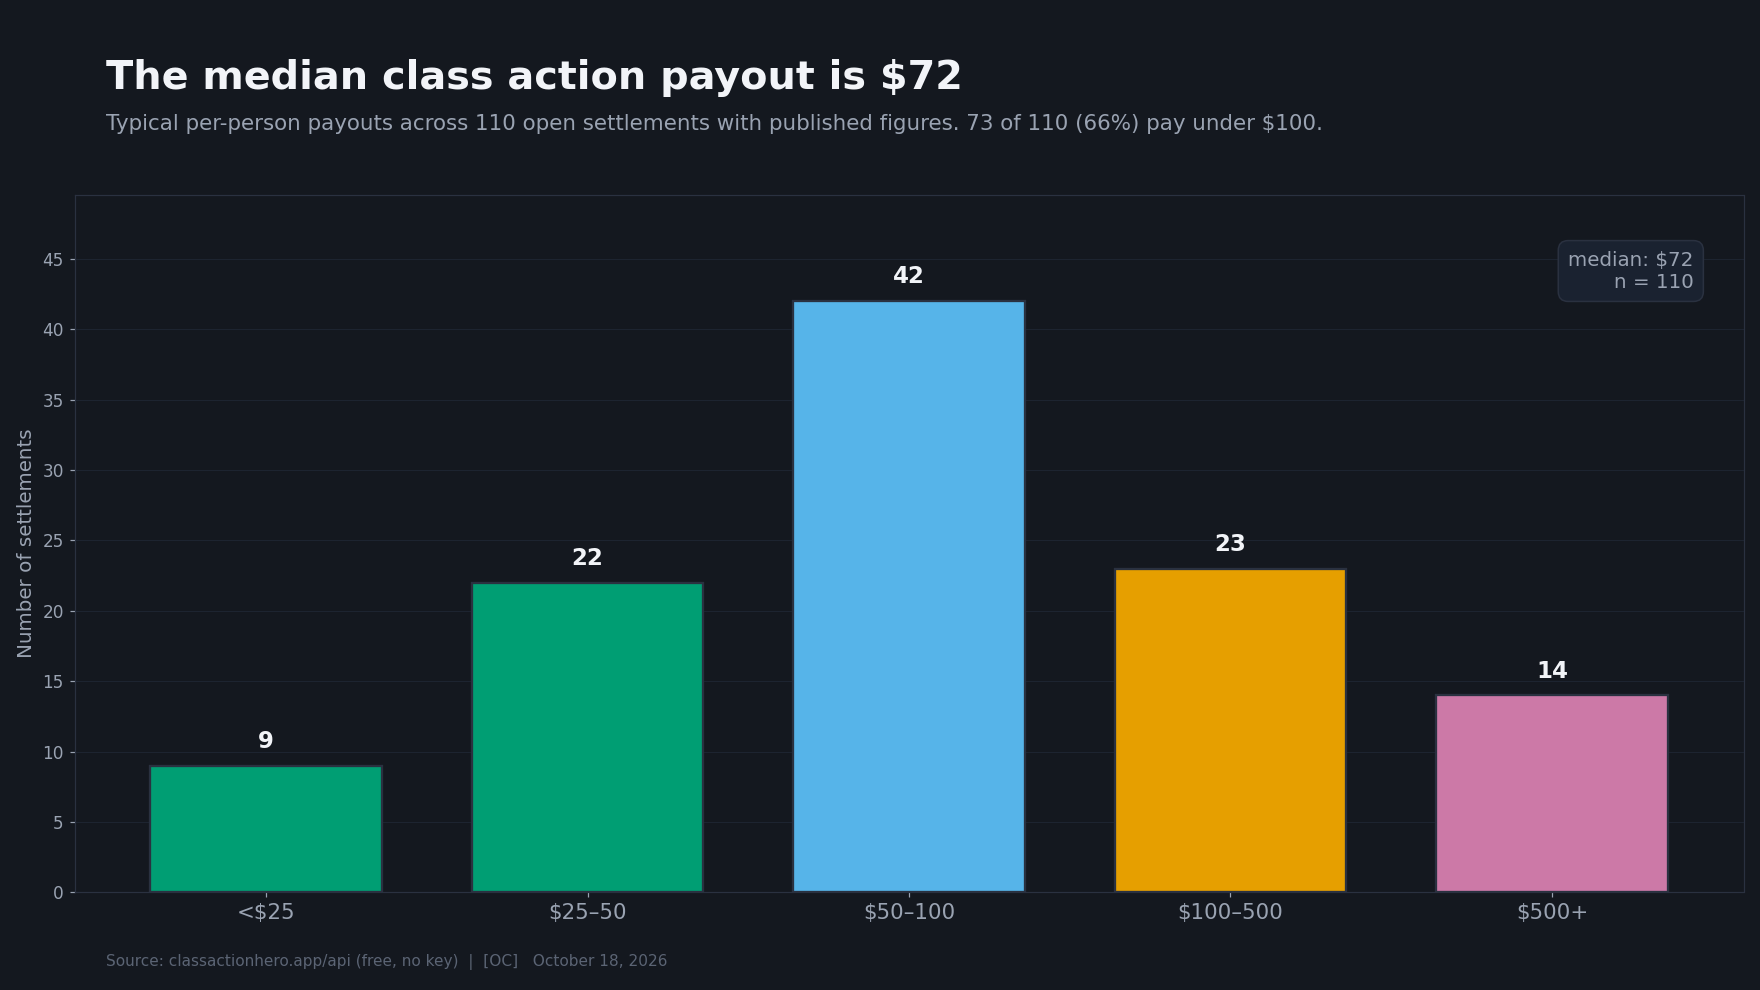
Finding: 73 of 110 settlements with published figures (66%) pay under $100 per person.
The headlines report billion-dollar funds. Individuals get the median: $72. The distribution clusters hard in the $50–100 range — enough to matter, not enough to make news. The 14 settlements paying $500+ are the outliers worth hunting.
Method: 110 of 241 settlements publish per-person payout figures. Typical cash payouts preferred over "up to $X" documented-loss caps.
5 antitrust cases hold 14x the money of 87 data breaches
October 18, 2026
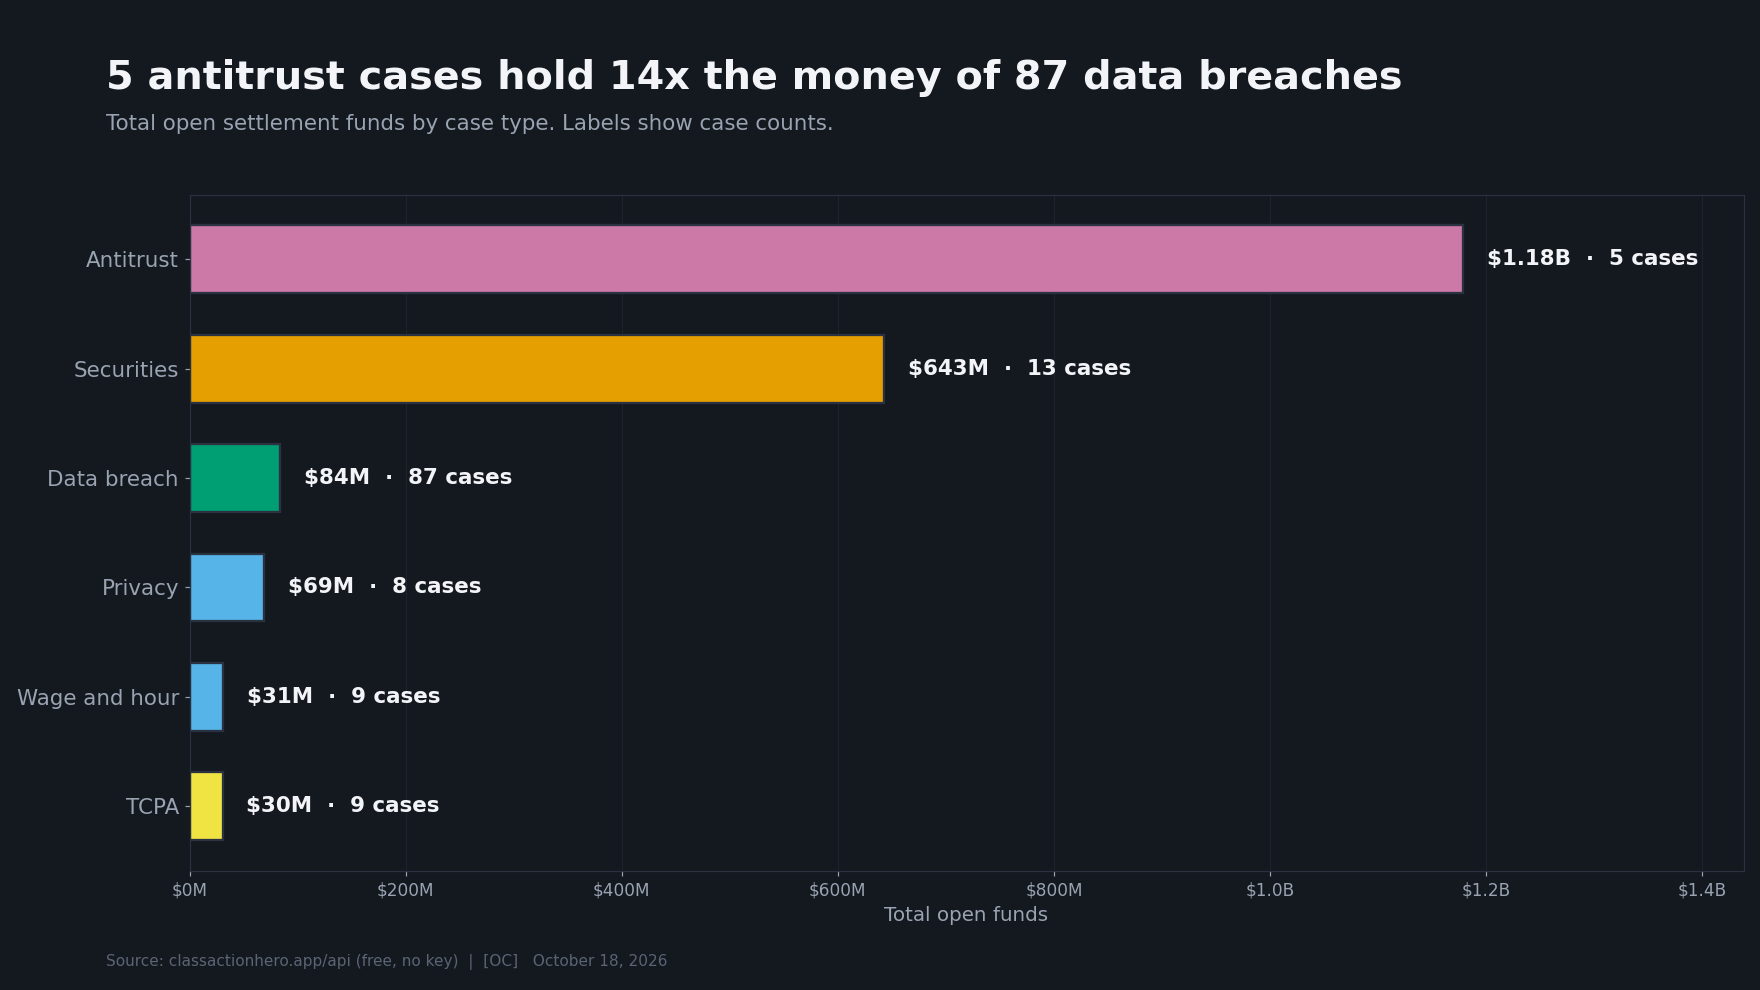
Finding: antitrust ($1.18B, 5 cases) and securities ($643M, 13 cases) dominate open funds. Data breaches lead in case count (87) but hold just $84M.
The cases that make headlines — data breaches — are where the least money sits per case. The quiet antitrust docket (Generic Drugs, RealPage, Pork) holds the real dollars. If you're eligible for an antitrust settlement, the payout math is completely different.
Method: categories from the site's classification rules; 110 uncategorized cases excluded.